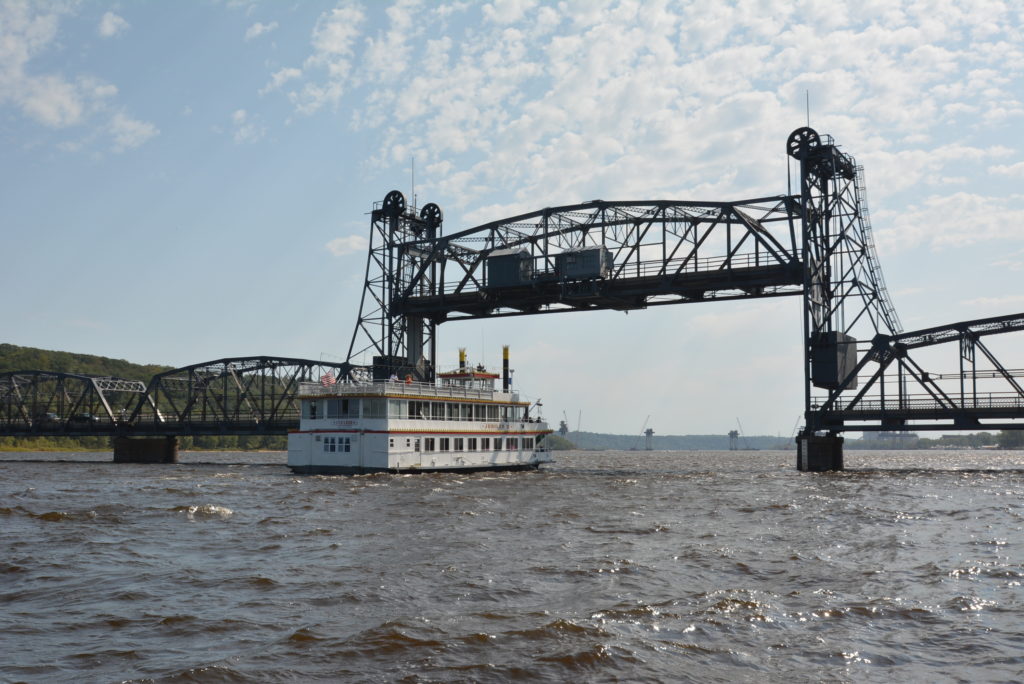
Stillwater MN Housing Market Statistics 2021 – Housing market appreciation exploded this past twelve months from August 2020 through August 2021.
For home sellers in Stillwater who took advantage of the shortage of housing inventory they walked away from the closing table with significant more net proceeds because of significant housing appreciation. Let’s take a look at some housing statistics that represent what took place in Stillwater pushing the appreciation to the incredible levels it did. What we will do is look at the rolling twelve months from August of 2020 through August 2021 to illustrate how significant the appreciation growth has been during this timeframe.
*In August of 2020 the ‘median sale price‘ was $360,000 and over the next 12-months it appreciated up to $445,550 for a net gain of 23.8%.
*In August of 2020 the ‘average sale price‘ was $401,093 and over the next 12-months home sales appreciated up to $496,524 for a net gain of 23.8%.
Check out my video below regarding the Stillwater housing market. If you are contemplating selling your home in the coming year keep checking back for monthly updates on what is happening in the housing market. Contact us directly if you would like to know what we anticipate will be happening in the Stillwater housing market in 2022.

Click here for video on Stillwater MN for more housing market statistics for 2021:
Stillwater MN Housing Trends – 2021
Stillwater MN Housing Trends – 2021 This video is for those home sellers, or home buyers in Stillwater MN to explain what has been happening within the community housing market. Consumers need to understand what is actually happening with median and average home sale price trends.


Leave a Reply
You must be logged in to post a comment.